|
Cococubed.com
|
| Unknown Pleasures |
Home
Astronomy Research
2026 Neutrinos From De-excitation
2024 Radiative Opacity
2024 Neutrino Emission from Stars
2023 White Dwarfs & 12C(α,γ)16O
2023 MESA VI
2022 Earendel, A Highly Magnified Star
2022 Black Hole Mass Spectrum
2021 Skye Equation of State
2021 White Dwarf Pulsations & 22Ne
Software Instruments
2026 AAS Journals
AAS YouTube
Listing of 500+ Author Videos
AAS Peer Review Workshops
Outreach Material
Education Material
Other Stuff:
Bicycle Adventures
Illustrations
Introductory Astronomy
Energy in Everyday Life
Geometry of Art and Nature
Seedhead phyllotaxis
Calculus
Logos and Motifs
Nifty HR diagrams
Supernova 1987A
Unknown Pleasures
Reaction network matrices
Nuclide charts
Presentations
Contact: F.X.Timmes
my one page vitae,
full vitae,
research statement, and
teaching statement.
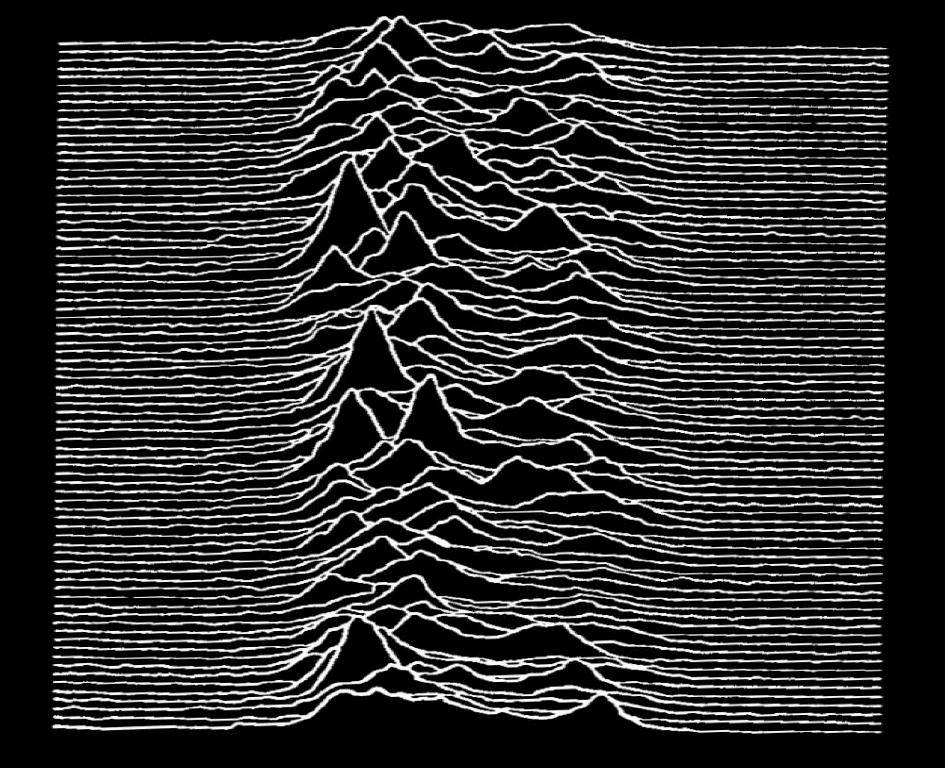
I knew the album cover art was a pulsar plot by the time I started graduate school in 1988 in astronomy and astrophysics at UC Santa Cruz, and I started searching. The style of the plot suggested it was made in the early-to-mid 1970's when such plots were popular. If only I had thought of asking Frank Drake (Harold Craft's thesis advisor) when I took his radio astronomy class! I thought I found the original in 1993 when I saw the green-white plot in "The Nature of Pulsars" by Jerry Ostriker, Scientific American 224, #1, Jan 1971, page 53 during a serendipitous perusal at the UC Santa Cruz science library. I was wrong. Adam Capriola did a deeper investigation into the origin of the plot, with the ultimate backtrace being completed by Jen Christiansen in her splendid 2015 Scientific American article Pop Culture Pulsar: Origin Story of Joy Division's Unknown Pleasures Album Cover. Hurray Jen!
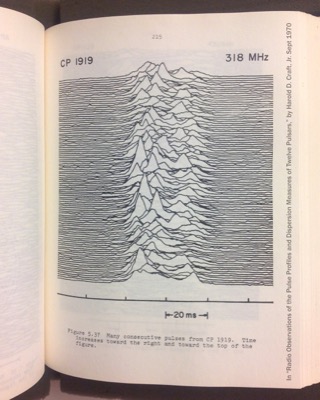
Harold Craft's 1970 thesis plot |
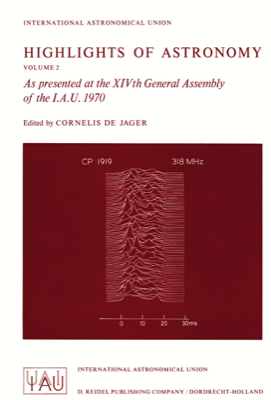
1970 IAU General Assembly; note time scale is different than Craft's. |
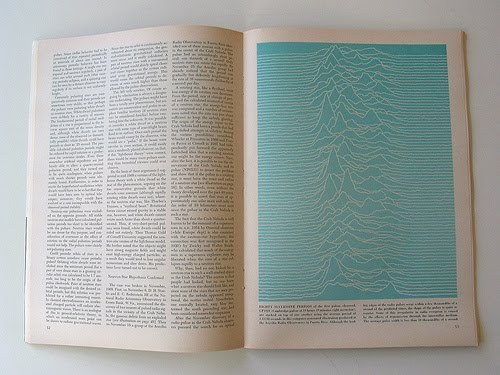
Ostriker's 1971 Sci Am article |
Unknown Pleasures (1979) |
The cover art for Joy Division's 1979 album "Unknown Pleasures" was originally published as a black-on-white science plot by Harold Craft in his 1970 PhD thesis "Radio observations of the pulse profiles and dispersion measures of twelve pulsars". Page 215 shows 80 successive pulses of the first pulsar observed, CP1919, tastefully stacked on top of one another. The plot was subsequently reproduced as a white-on-red image for the cover art of the 1970 International Astronomy Union General Assembly "Highlights of Astronomy" edited by Cornelis De Jager, as the green-on-white image in Ostriker's article mentioned above, as a white-on-black image in Walter Herdeg's 1974 "Graphis Diagrams: The Graphic Visualization of Abstract Data", and then in the black-on-white style in Simon Mitton's editing of the 1977 edition of "The Cambridge Encyclopaedia of Astronomy".
Here is an attempt at creating vector versions of Craft's figure 5-37. The svg below is in black-on-white, and click to get a pdf in glorious white-on-black.

|